2. Via 2.0 Cartography on Zebrahub (Trajectory Inference)
This tutorial focuses on how to perform TI analysis of Zebrahub. See Tutorial #3 for Atlas View creation
import scanpy as sc
import matplotlib.pyplot as plt
import numpy as np
import pyVIA.core as via
from datetime import datetime
import pyVIA.datasets_via as datasets
Load the data
Data has been filtered and library normalized and log1p. Data is annotated with time/stage, cluster labels, and cell type labels (coarse and fine).
print(f'{datetime.now()}\tStart reading data')
adata=sc.read_h5ad( filename='/home/user/Trajectory/Datasets/Zebrafish_Lange2023/Rawdata/Zebrahub_data_via.h5ad')
#compute PCA
adata.uns['log1p']['base'] = None #fix for small bug in scanpy #see https://github.com/theislab/single-cell-tutorial/issues/97
sc.pp.highly_variable_genes(adata, n_top_genes=2000)
sc.tl.pca(adata, n_comps=100)
print(adata)

#load the adata_velo below if you want to try to use velocity. this is a 8GB file so is very RAM intensive
adata_velo = sc.read_h5ad('/home/user/Trajectory/Datasets/Zebrafish_Lange2023/Rawdata/Zebrahub_data_velocity_via.h5ad') #10GB file. if you dont have the RAM to load this, then you can still run Via2 without velocity.
print('adata_velo')
print(adata_velo)


#the data can also be loaded using
adata = datasets.zebrahub(foldername="./", use_velocity = False)
2023-09-25 08:25:15.560669	Start reading data
AnnData object with n_obs × n_vars = 119457 × 28187
    obs: 'n_genes', 'n_counts', 'fish', 'timepoint_cluster', 'n_genes_by_counts', 'total_counts', 'total_counts_mt', 'pct_counts_mt', 'total_counts_nc', 'pct_counts_nc', 'developmental_stage', 'timepoint', 'zebrafish_anatomy_ontology_class', 'zebrafish_anatomy_ontology_id', 'parc', 'kmeans50', 'celltype_extrainfo', 'zebrafish_anatomy_ontology_class_shobi', 'adjusted_timepoint', 'bool_list', 'global annotation', 'time_coarse_cell_type', 'time_fine_cell_type', 'parc_cluster', 'parc_cluster_and_cell_type'
    var: 'gene_ids', 'feature_types', 'genome', 'mt', 'nc', 'n_cells_by_counts', 'mean_counts', 'pct_dropout_by_counts', 'total_counts', 'n_cells', 'highly_variable', 'means', 'dispersions', 'dispersions_norm'
    uns: 'global_annotation_colors', 'hvg', 'log1p', 'pca', 'timepoint_colors', 'zebrafish_anatomy_ontology_class_colors', 'zebrafish_anatomy_ontology_id_colors'
    obsm: 'X_U', 'X_Via2_Atlas', 'X_pca', 'X_umap'
    varm: 'PCs'
    layers: 'counts'
adata_velo
AnnData object with n_obs × n_vars = 119457 × 3000
    obs: 'clusters', 'seurat_clusters', 'timepoint', 'fish', 'initial_size_spliced', 'initial_size_unspliced', 'initial_size', 'n_counts', 'velocity_self_transition', 'velocity_length', 'velocity_confidence', 'velocity_confidence_transition', 'barcode in labeled data', 'parc', 'kmeans50', 'ontology_class', 'parc_cluster', 'parc_cluster_and_cell_type'
    var: 'n_cells', 'highly_variable', 'means', 'dispersions', 'dispersions_norm', 'mean', 'std', 'gene_count_corr', 'velocity_gamma', 'velocity_qreg_ratio', 'velocity_r2', 'velocity_genes', 'fit_alpha', 'fit_beta', 'fit_gamma', 'fit_t_', 'fit_scaling', 'fit_std_u', 'fit_std_s', 'fit_likelihood', 'fit_u0', 'fit_s0', 'fit_pval_steady', 'fit_steady_u', 'fit_steady_s', 'fit_variance', 'fit_alignment_scaling', 'fit_r2'
    uns: 'hvg', 'neighbors', 'pca', 'recover_dynamics', 'seurat_clusters_colors', 'umap', 'velocity_graph', 'velocity_graph_neg', 'velocity_params'
    obsm: 'X_Via2_Atlas', 'X_pca', 'X_umap', 'noveloumap', 'velocity_umap'
    varm: 'PCs', 'loss'
    layers: 'Ms', 'Mu', 'counts', 'fit_t', 'fit_tau', 'fit_tau_', 'matrix', 'spliced', 'unspliced', 'variance_velocity', 'velocity', 'velocity_u'
    obsp: 'connectivities', 'distances'
Extract some annotation
n_cells = adata.shape[0]
print('cells is', n_cells)
parc_cluster = [i for i in adata.obs['parc_cluster']]
parc_cluster_and_cell_type = [i for i in adata.obs['parc_cluster_and_cell_type']]
coarse_cell_type = [i for i in adata.obs['zebrafish_anatomy_ontology_class']]
fine_cell_type = [i for i in adata.obs['zebrafish_anatomy_ontology_class_shobi']] #consolidated annotaions from individual time point files
coarse_fine_cell_type = [coarse_cell_type[i] + fine_cell_type[i] for i in range(n_cells)]
time_point_numeric = [i for i in adata.obs['adjusted_timepoint']] #assigned a numeric value to each stage (e.g. 5hpf is 5, 10hpf is 10,...)
early_cell_type = [i if str(i) != 'nan' else '' for i in adata.obs['global annotation']]

hybrid_cell_time = [str(fine_cell_type[i]) + '_'+early_cell_type[i]+'_'+str(time_point_numeric[i]) for i in range(n_cells)] #labels of early stage cells which was provided for cells <24hpf also included
parc_numeric_cluster_labels = [i for i in adata.obs['parc']]
parc_cluster = [i for i in adata.obs['parc_cluster']]
cells is 119457
Find a suitable root
root_str = 'paraxial mesoderm_Somites_0'
loc_root = np.where(np.asarray(hybrid_cell_time) == root_str)[0] #'paraxial mesoderm_PSM_0' 1 cell , 'paraxial mesoderm_Somites_0' has 51 cells, 'paraxial mesoderm_Muscle_0', 'tail bud_NMPs_0'
root = [loc_root[0]]
n_pcs = 100
print(f'{datetime.now()}\troot is cell number  {root[0]} of type {fine_cell_type[root[0]]}')
2023-09-25 08:28:03.566017 root is cell number 2604 of type paraxial mesoderm
Initialize parameters
knn=30
time_series = True
memory = 50
jac_std_global = 1
random_seed = 0#1
knn_sequential = 5
t_diff_step = 2
do_gaussian_kernel_edgeweights = False
edgebundle_pruning_twice = True
cluster_graph_pruning_std = 0.15
edgebundle_pruning = 0.05
neighboring_terminal_states_threshold = 4
viagraph_decay = 0.7
max_vis_out = 2
use_velocity = True
velo_weight = 0.5

if use_velocity:
    gene_matrix =np.asmatrix(adata_velo.layers['Ms'])
    velocity_matrix = np.asmatrix(adata_velo.layers['velocity'])
    velo_weight=velo_weight
else:
    gene_matrix =None
    velocity_matrix = None
    velo_weight=0
Set terminal states (optional)
# The parameter "user_defined_terminal_group" is being set to a list of group level annotations corresponding to the provided true_label. These were terminal fates detected in previous runs and saved for reproducability.
# This parameter can also be left to its default user_defined_terminal_group = []. the results should be similar.
user_defined_cellfates= ['0_cartilage element', '2_dermis', '49_fin',
                                          '67_pharyngeal arch', '120_cranial cartilage',
                                          '1_forebrain', '71_neuron', '89_diencephalon',
                                          '136_radial glial cell',
                                          '10_epidermal cell', '83_neuromast',
                                          '145_enteric musculature', '55_myotome',
                                          '46_hematopoietic cell',   '102_vasculature', '127_Muller cell', '105_oligodendrocyte',   '69_liver', '90_pharynx',
                                          '95_intestine']
Initialize and Run the Via2.0 Class
# Initialize and Run the Via2.0 Class
print(f'{datetime.now()}\tRun Via2.0')

v0 = via.VIA(adata.obsm['X_pca'][:, 0:n_pcs], true_label=parc_cluster_and_cell_type, jac_std_global=jac_std_global,
             labels=parc_cluster,
             dist_std_local=1, knn=knn, memory=memory,
             user_defined_terminal_group=user_defined_cellfates,
             cluster_graph_pruning_std=cluster_graph_pruning_std,
             neighboring_terminal_states_threshold=neighboring_terminal_states_threshold,
             too_big_factor=0.3, resolution_parameter=1,
             root_user=root, dataset='', random_seed=random_seed,
             is_coarse=True, preserve_disconnected=False, pseudotime_threshold_TS=40, x_lazy=0.99,
             do_gaussian_kernel_edgeweights=do_gaussian_kernel_edgeweights,
             alpha_teleport=0.99, edgebundle_pruning=edgebundle_pruning, edgebundle_pruning_twice=True,
             time_series=time_series, time_series_labels=time_point_numeric, knn_sequential=knn_sequential,
             knn_sequential_reverse=knn_sequential, t_diff_step=t_diff_step, velo_weight=velo_weight, velocity_matrix=velocity_matrix, gene_matrix=gene_matrix,
             do_compute_embedding=False)

v0.run_VIA()
v0.embedding = adata.obsm['X_Via2_Atlas']
2023-09-25 08:28:03.589451	Run Via2.0
2023-09-25 08:28:04.804497	Running VIA over input data of 119457 (samples) x 100 (features)
2023-09-25 08:28:04.804574	Knngraph has 30 neighbors
2023-09-25 08:28:42.727156	Using time series information to guide knn graph construction
2023-09-25 08:28:42.736297	Time series ordered set [0, 5, 10, 15, 20, 25, 30, 35, 40, 45]
2023-09-25 08:29:35.321478	Shape neighbors (119457, 30) and sequential neighbors (119457, 10)
2023-09-25 08:29:35.354718	Shape augmented neighbors (119457, 40)
2023-09-25 08:29:35.380011	Actual average allowable time difference between nodes is 10.0
2023-09-25 08:30:02.089539	Finished global pruning of 30-knn graph used for clustering at level of 1. Kept 87.6 % of edges.
2023-09-25 08:30:02.213207	Number of connected components used for clustergraph  is 1
2023-09-25 08:30:18.393414	Using predfined labels provided by user (this must be provided as an array)
2023-09-25 08:30:18.393502	Making cluster graph. Global cluster graph pruning level: 0.15
2023-09-25 08:30:19.415532	Graph has 1 connected components before pruning
2023-09-25 08:30:19.425338	Graph has 1 connected components after pruning
2023-09-25 08:30:19.425605	Graph has 1 connected components after reconnecting
2023-09-25 08:30:19.427311	44.3% links trimmed from local pruning relative to start
2023-09-25 08:30:19.427334	87.4% links trimmed from global pruning relative to start
2023-09-25 08:30:19.430975	Graph has 1 connected components before pruning
2023-09-25 08:30:19.444368	Graph has 3 connected components after pruning
2023-09-25 08:30:19.448015	Graph has 1 connected components after reconnecting
2023-09-25 08:30:19.449751	44.3% links trimmed from local pruning relative to start
2023-09-25 08:30:19.449775	90.1% links trimmed from global pruning relative to start
size velocity matrix 119457 (119457, 3000)
/home/user/anaconda3/envs/Via2Env_py10/lib/python3.10/site-packages/scipy/sparse/_index.py:103: SparseEfficiencyWarning: Changing the sparsity structure of a csr_matrix is expensive. lil_matrix is more efficient.
  self._set_intXint(row, col, x.flat[0])
2023-09-25 08:30:23.954500	Looking for initial states
2023-09-25 08:30:24.106221	Stationary distribution normed [0.01  0.005 0.009 0.032 0.015 0.01  0.006 0.006 0.008 0.022 0.008 0.009
 0.012 0.007 0.009 0.011 0.006 0.021 0.001 0.002 0.008 0.004 0.003 0.009
 0.006 0.014 0.006 0.016 0.011 0.001 0.003 0.008 0.003 0.007 0.007 0.004
 0.006 0.001 0.007 0.002 0.005 0.012 0.009 0.005 0.007 0.018 0.    0.005
 0.011 0.006 0.007 0.008 0.017 0.006 0.017 0.004 0.005 0.003 0.01  0.005
 0.012 0.007 0.015 0.002 0.007 0.005 0.006 0.005 0.018 0.005 0.011 0.006
 0.    0.008 0.006 0.006 0.005 0.004 0.003 0.007 0.006 0.008 0.001 0.002
 0.011 0.008 0.001 0.005 0.002 0.003 0.005 0.001 0.006 0.003 0.002 0.006
 0.006 0.019 0.008 0.007 0.003 0.012 0.001 0.004 0.009 0.001 0.001 0.002
 0.012 0.008 0.007 0.011 0.003 0.008 0.005 0.001 0.004 0.006 0.011 0.002
 0.005 0.005 0.021 0.009 0.006 0.002 0.005 0.001 0.001 0.002 0.005 0.002
 0.008 0.015 0.    0.017 0.006 0.005 0.005 0.004 0.001 0.004 0.006 0.005
 0.003 0.005]
2023-09-25 08:30:24.107358	Top 5 candidates for root: [134  72  46  37  82  18 102 127  86 105] with stationary prob (%) [0.032 0.039 0.043 0.055 0.055 0.07  0.076 0.082 0.089 0.092]
2023-09-25 08:30:24.107614	Top 5 candidates for terminal: [  3   9 122  17  97]
cell type of suggested roots: ['120_cranial cartilage', '24_myotome', '6_ventricular zone', '49_pectoral fin', '89_diencephalon', '74_cranial cartilage', '23_eye', '1_forebrain', '107_neuron', '103_fin']
cell stage of suggested roots: [45, 15, 35, 45, 35, 40, 35, 35, 40, 25]
2023-09-25 08:30:24.122752	component number 0 out of  [0]
2023-09-25 08:30:24.460261	The root index, 2604 provided by the user belongs to cluster number 97 and corresponds to cell type 97_paraxial mesoderm
2023-09-25 08:30:24.629263	Computing lazy-teleporting expected hitting times
2023-09-25 08:30:32.855588	 ended all multiprocesses, will retrieve and reshape
try rw2 hitting times setup
start computing walks with rw2 method
g.indptr.size, 147
/home/user/anaconda3/envs/Via2Env_py10/lib/python3.10/site-packages/pecanpy/graph.py:90: UserWarning: WARNING: Implicitly set node IDs to the canonical node ordering due to missing IDs field in the raw CSR npz file. This warning message can be suppressed by setting implicit_ids to True in the read_npz function call, or by setting the --implicit_ids flag in the CLI
  warnings.warn(
memory for rw2 hittings times  2. Using rw2 based pt
do scaling of pt
2023-09-25 08:30:41.521269	Terminal cluster list based on user defined cells/groups: [('0_cartilage element', 0), ('2_dermis', 2), ('49_fin', 49), ('67_pharyngeal arch', 67), ('120_cranial cartilage', 120), ('1_forebrain', 1), ('71_neuron', 71), ('89_diencephalon', 89), ('136_radial glial cell', 136), ('10_epidermal cell', 10), ('83_neuromast', 83), ('145_enteric musculature', 145), ('55_myotome', 55), ('46_hematopoietic cell', 46), ('102_vasculature', 102), ('127_Muller cell', 127), ('105_oligodendrocyte', 105), ('69_liver', 69), ('90_pharynx', 90), ('95_intestine', 95)]
2023-09-25 08:30:41.521658	Terminal clusters corresponding to unique lineages in this component are [0, 2, 49, 67, 120, 1, 71, 89, 136, 10, 83, 145, 55, 46, 102, 127, 105, 69, 90, 95]
TESTING rw2_lineage probability at memory 50
testing rw2 lineage probability at memory 50
g.indptr.size, 147
/home/user/anaconda3/envs/Via2Env_py10/lib/python3.10/site-packages/pecanpy/graph.py:90: UserWarning: WARNING: Implicitly set node IDs to the canonical node ordering due to missing IDs field in the raw CSR npz file. This warning message can be suppressed by setting implicit_ids to True in the read_npz function call, or by setting the --implicit_ids flag in the CLI
  warnings.warn(
2023-09-25 08:30:46.871385	 Cluster or terminal cell fate 0 is reached 194.0 times
2023-09-25 08:30:47.265164	 Cluster or terminal cell fate 2 is reached 211.0 times
2023-09-25 08:30:47.620006	 Cluster or terminal cell fate 49 is reached 38.0 times
2023-09-25 08:30:47.959715	 Cluster or terminal cell fate 67 is reached 206.0 times
2023-09-25 08:30:48.442676	 Cluster or terminal cell fate 120 is reached 52.0 times
2023-09-25 08:30:48.917698	 Cluster or terminal cell fate 1 is reached 265.0 times
2023-09-25 08:30:49.369804	 Cluster or terminal cell fate 71 is reached 148.0 times
2023-09-25 08:30:49.691185	 Cluster or terminal cell fate 89 is reached 485.0 times
2023-09-25 08:30:50.014253	 Cluster or terminal cell fate 136 is reached 137.0 times
2023-09-25 08:30:50.368288	 Cluster or terminal cell fate 10 is reached 29.0 times
2023-09-25 08:30:50.585364	 Cluster or terminal cell fate 83 is reached 128.0 times
2023-09-25 08:30:50.860216	 Cluster or terminal cell fate 145 is reached 37.0 times
2023-09-25 08:30:51.067859	 Cluster or terminal cell fate 55 is reached 76.0 times
2023-09-25 08:30:51.453572	 Cluster or terminal cell fate 46 is reached 21.0 times
2023-09-25 08:30:51.802014	 Cluster or terminal cell fate 102 is reached 62.0 times
2023-09-25 08:30:52.075750	 Cluster or terminal cell fate 127 is reached 70.0 times
2023-09-25 08:30:52.443008	 Cluster or terminal cell fate 105 is reached 111.0 times
2023-09-25 08:30:52.775031	 Cluster or terminal cell fate 69 is reached 26.0 times
2023-09-25 08:30:53.049582	 Cluster or terminal cell fate 90 is reached 26.0 times
2023-09-25 08:30:53.420929	 Cluster or terminal cell fate 95 is reached 15.0 times
2023-09-25 08:30:54.022736	There are (20) terminal clusters corresponding to unique lineages {0: '0_pectoral fin', 2: '2_dermis', 49: '49_fin', 67: '67_pharyngeal arch', 120: '120_cranial cartilage', 1: '1_forebrain', 71: '71_neuron', 89: '89_diencephalon', 136: '136_radial glial cell', 10: '10_epidermal cell', 83: '83_neuromast', 145: '145_enteric musculature', 55: '55_myotome', 46: '46_hematopoietic cell', 102: '102_vasculature', 127: '127_Muller cell', 105: '105_oligodendrocyte', 69: '69_liver', 90: '90_pharynx', 95: '95_intestine'}
2023-09-25 08:30:54.022861	Begin projection of pseudotime and lineage likelihood
2023-09-25 08:31:03.461077	Start reading data
2023-09-25 08:31:03.461154	Correlation of Via pseudotime with developmental stage 72.11 %
2023-09-25 08:31:03.498392	Transition matrix with weight of 0.5 on RNA velocity
2023-09-25 08:31:03.498789	Cluster graph layout based on forward biasing
2023-09-25 08:31:03.528940	Graph has 1 connected components before pruning
2023-09-25 08:31:03.536532	Graph has 57 connected components after pruning
2023-09-25 08:31:03.599803	Graph has 1 connected components after reconnecting
2023-09-25 08:31:03.600527	68.3% links trimmed from local pruning relative to start
2023-09-25 08:31:03.600550	81.0% links trimmed from global pruning relative to start
2023-09-25 08:31:03.600584	Additional Visual cluster graph pruning for edge bundling at level: 0.15
2023-09-25 08:31:03.602326	Make via clustergraph edgebundle
/home/user/anaconda3/envs/Via2Env_py10/lib/python3.10/site-packages/scipy/sparse/_index.py:103: SparseEfficiencyWarning: Changing the sparsity structure of a csr_matrix is expensive. lil_matrix is more efficient.
  self._set_intXint(row, col, x.flat[0])
2023-09-25 08:31:06.258257	Hammer dims: Nodes shape: (146, 2) Edges shape: (918, 3)
2023-09-25 08:31:06.490458	Time elapsed 151.8 seconds
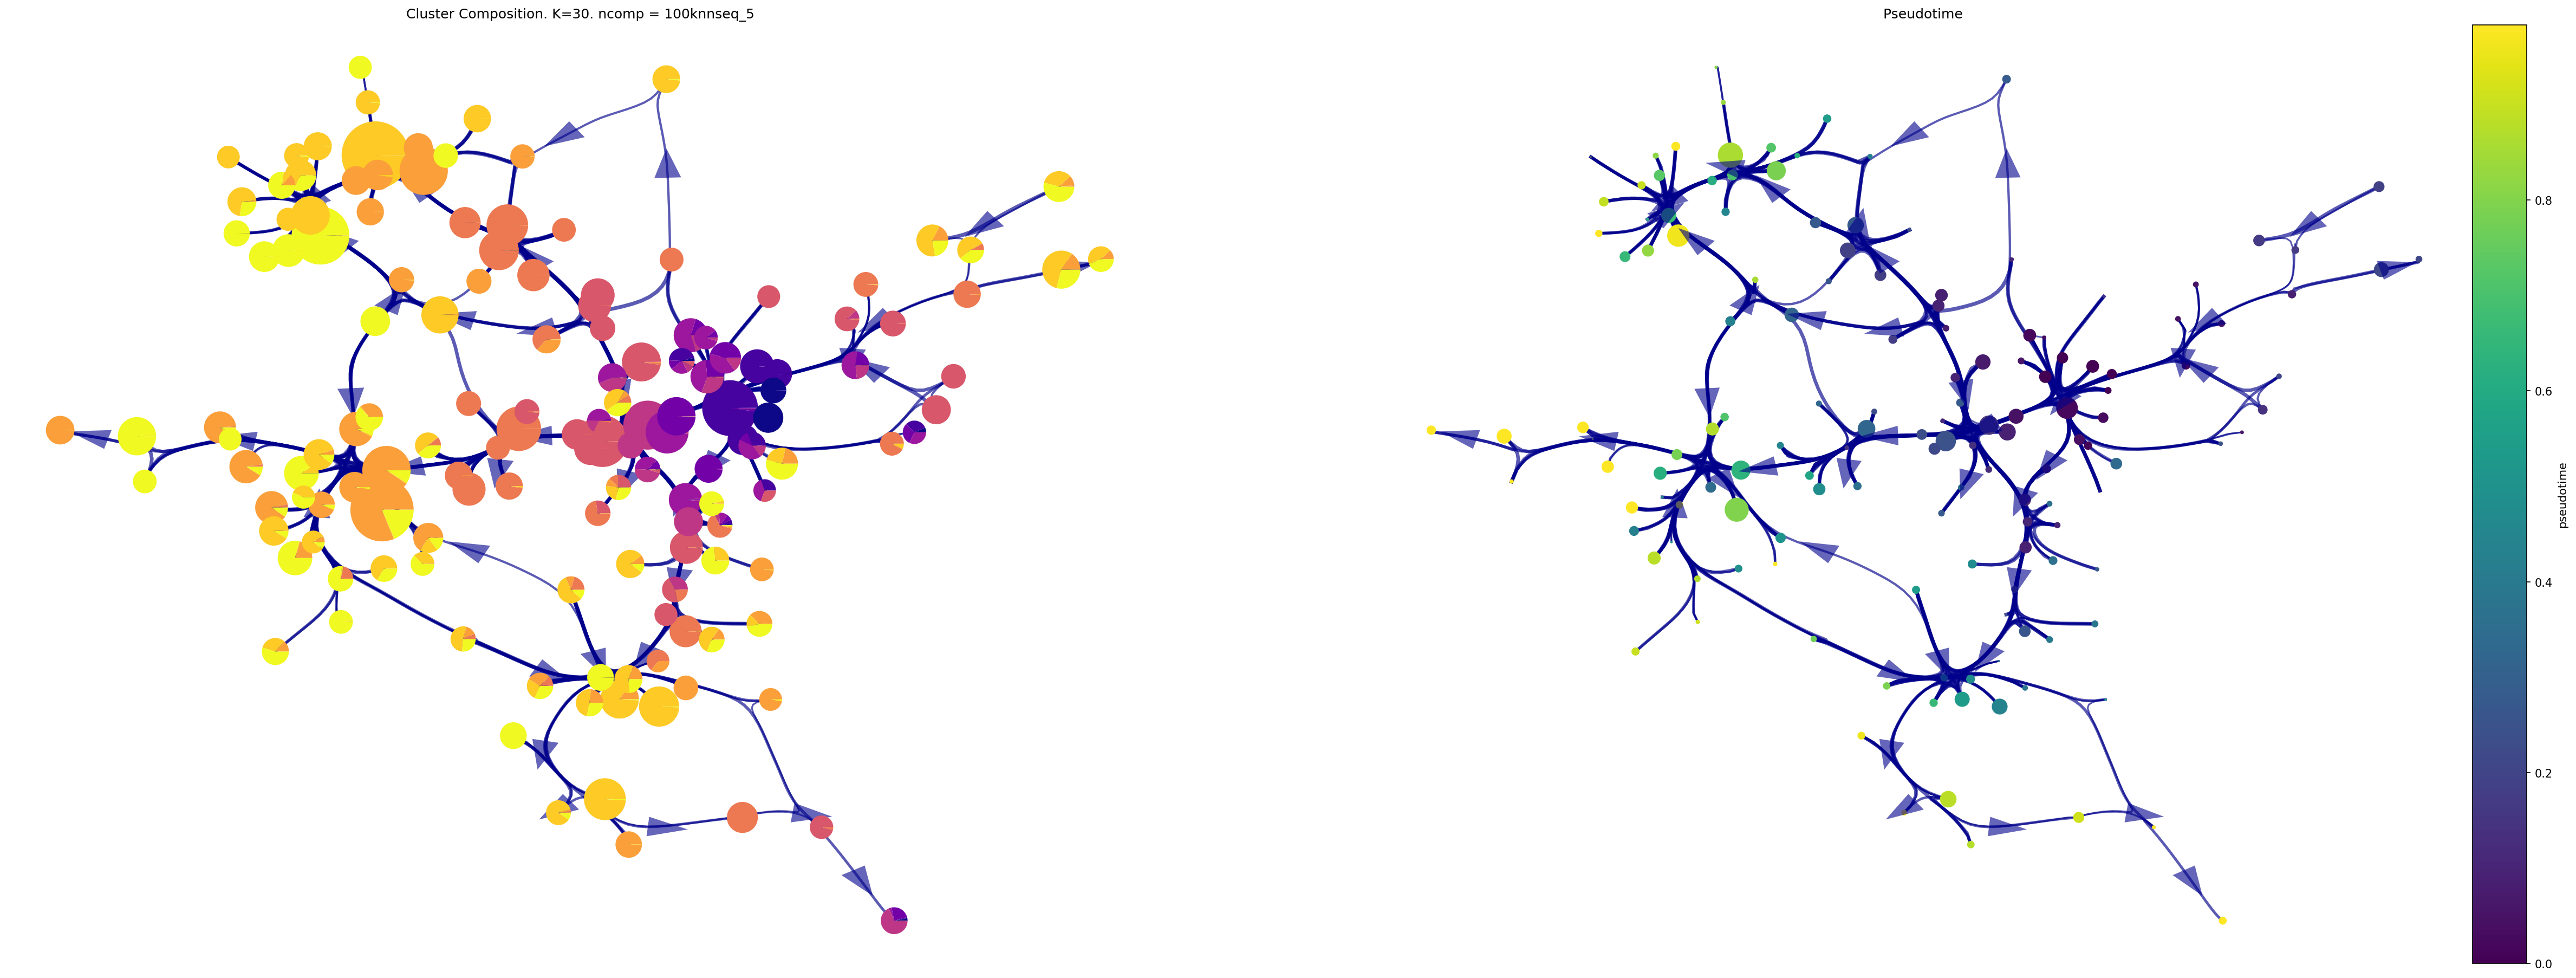
Visualise Via 2.0 Cluster Graph
print(f'{datetime.now()}\t plotting piechart_graph')
fig,ax1, ax2 = via.draw_piechart_graph(via_object=v0, reference_labels=time_point_numeric, show_legend=False, ax_text=False,
headwidth_arrow=0.8, highlight_terminal_clusters=False, cmap_piechart='plasma', cmap='viridis',
pie_size_scale=0.6,size_node_notpiechart=1)
fig.set_size_inches(40, 15)
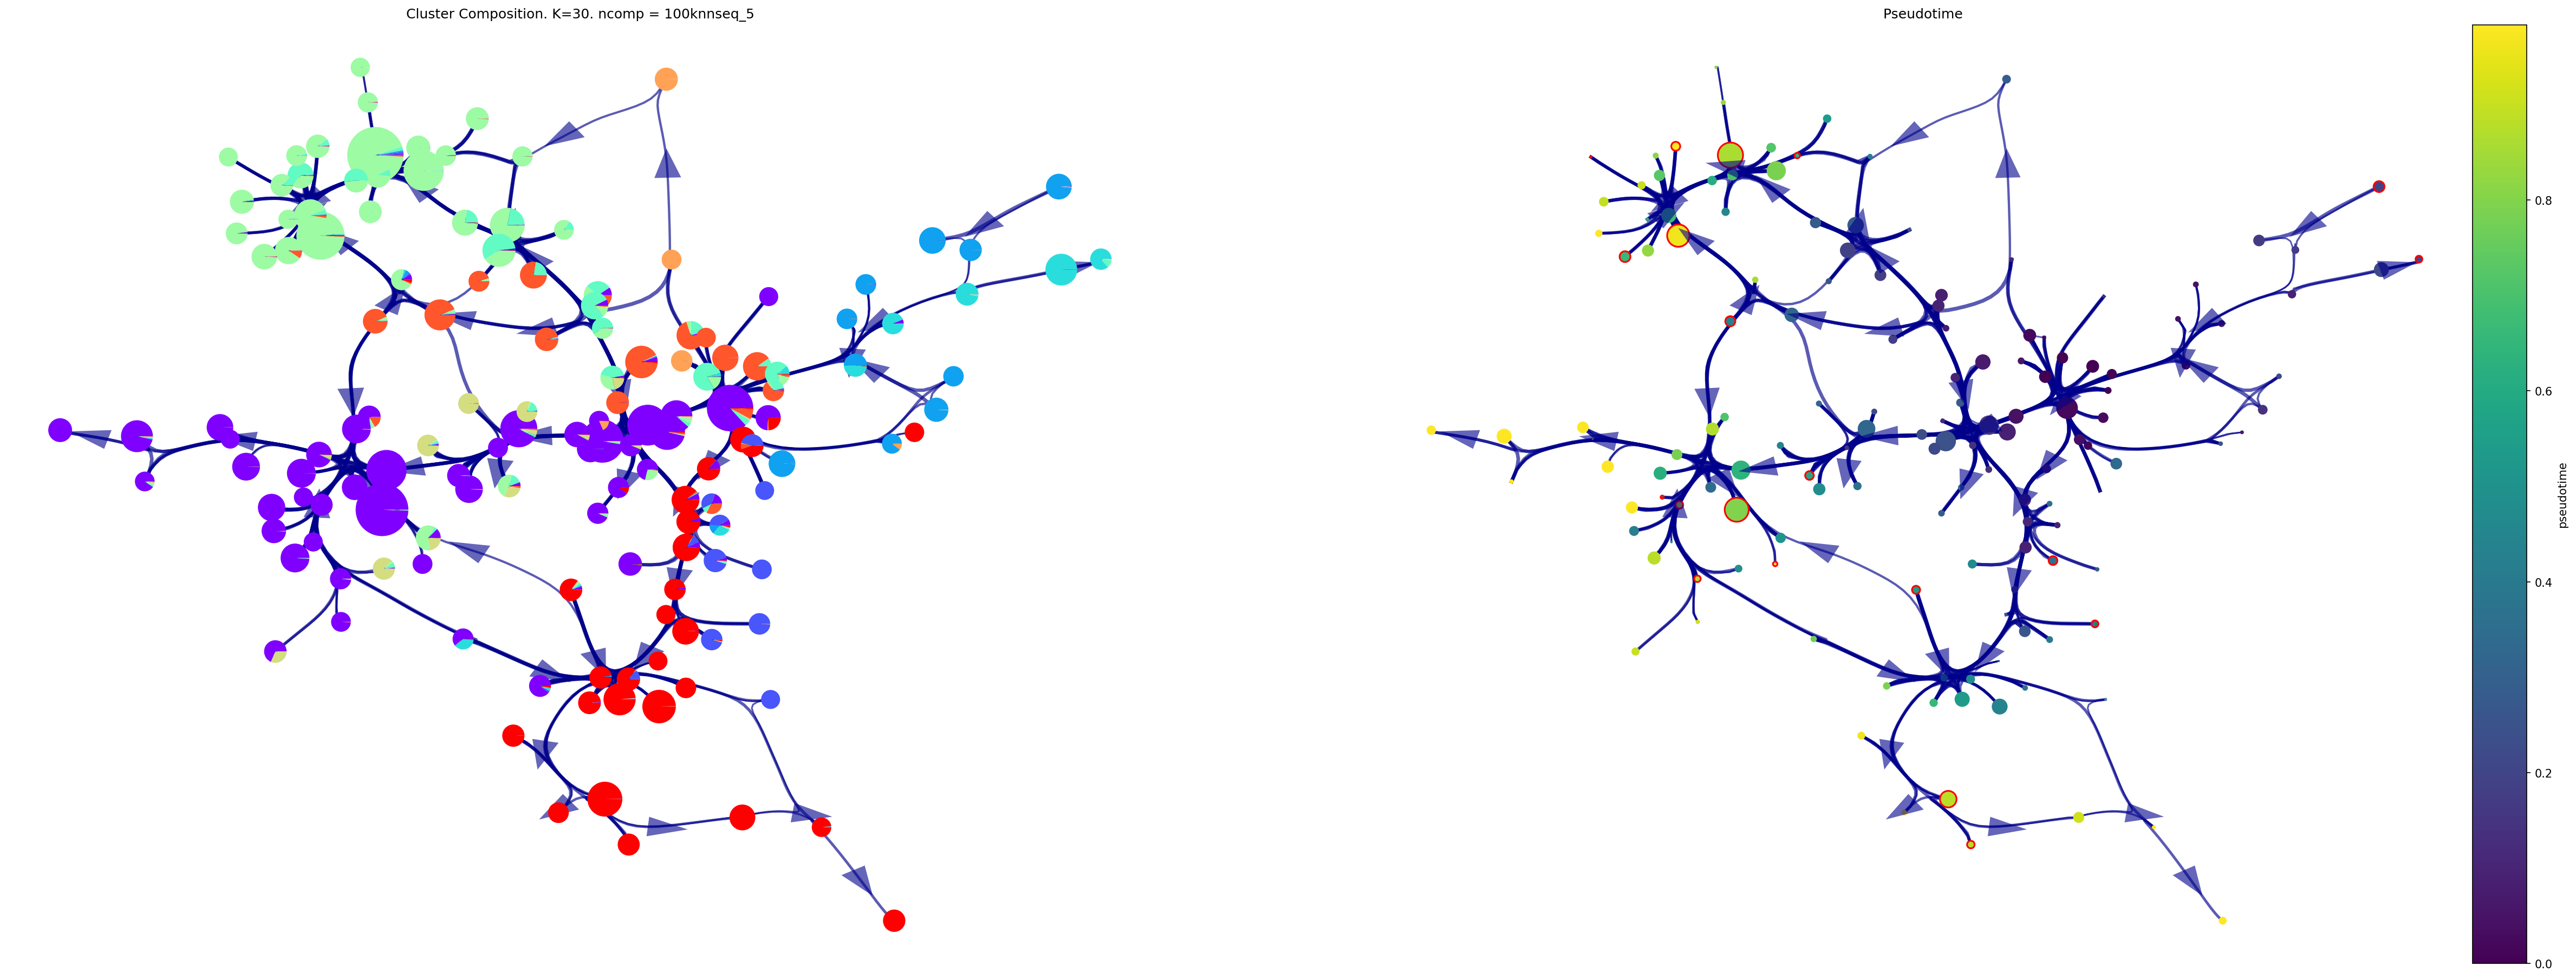
fig,ax1, ax2=via.draw_piechart_graph(via_object=v0, reference_labels=coarse_cell_type, show_legend=False, ax_text=False,
headwidth_arrow=0.8, highlight_terminal_clusters=True, cmap_piechart='rainbow',cmap='viridis',
pie_size_scale=0.5,size_node_notpiechart=1)
fig.set_size_inches(40, 15)
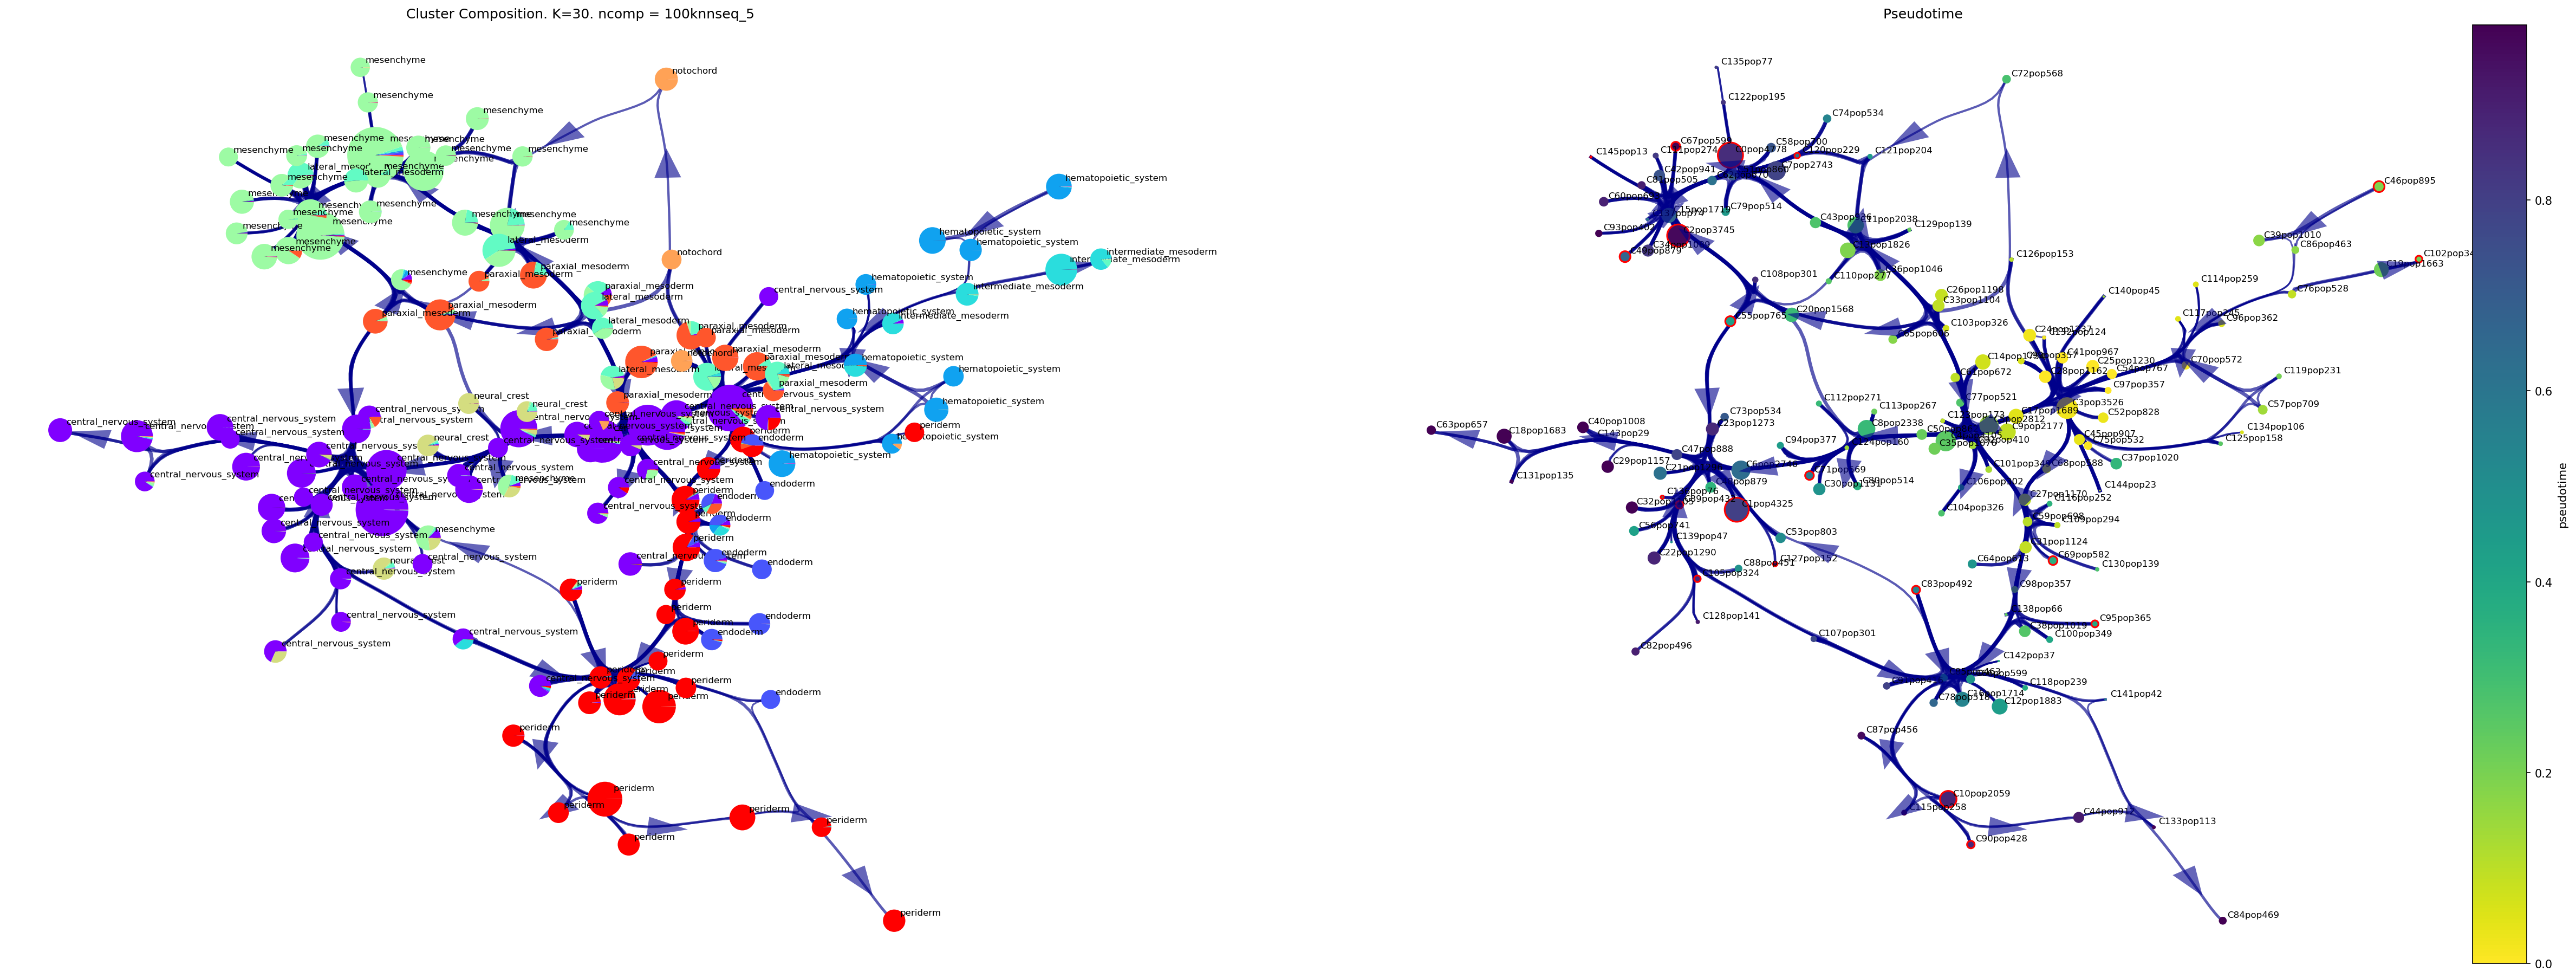
fig,ax1, ax2=via.draw_piechart_graph(via_object=v0, reference_labels=coarse_cell_type, show_legend=False, ax_text=True,
headwidth_arrow=0.8, highlight_terminal_clusters=True, cmap_piechart='rainbow',
pie_size_scale=0.5,size_node_notpiechart=1)
fig.set_size_inches(40, 15)
plt.show()
2023-09-25 08:31:06.497122 plotting piechart_graph
/home/user/PycharmProjects/Via2_May2023_py310/plotting_via.py:3242: UserWarning: No data for colormapping provided via 'c'. Parameters 'cmap' will be ignored
  sct = ax.scatter(node_pos[:, 0], node_pos[:, 1],
/home/user/PycharmProjects/Via2_May2023_py310/plotting_via.py:3242: UserWarning: No data for colormapping provided via 'c'. Parameters 'cmap' will be ignored
  sct = ax.scatter(node_pos[:, 0], node_pos[:, 1],
/home/user/PycharmProjects/Via2_May2023_py310/plotting_via.py:3242: UserWarning: No data for colormapping provided via 'c'. Parameters 'cmap' will be ignored
  sct = ax.scatter(node_pos[:, 0], node_pos[:, 1],
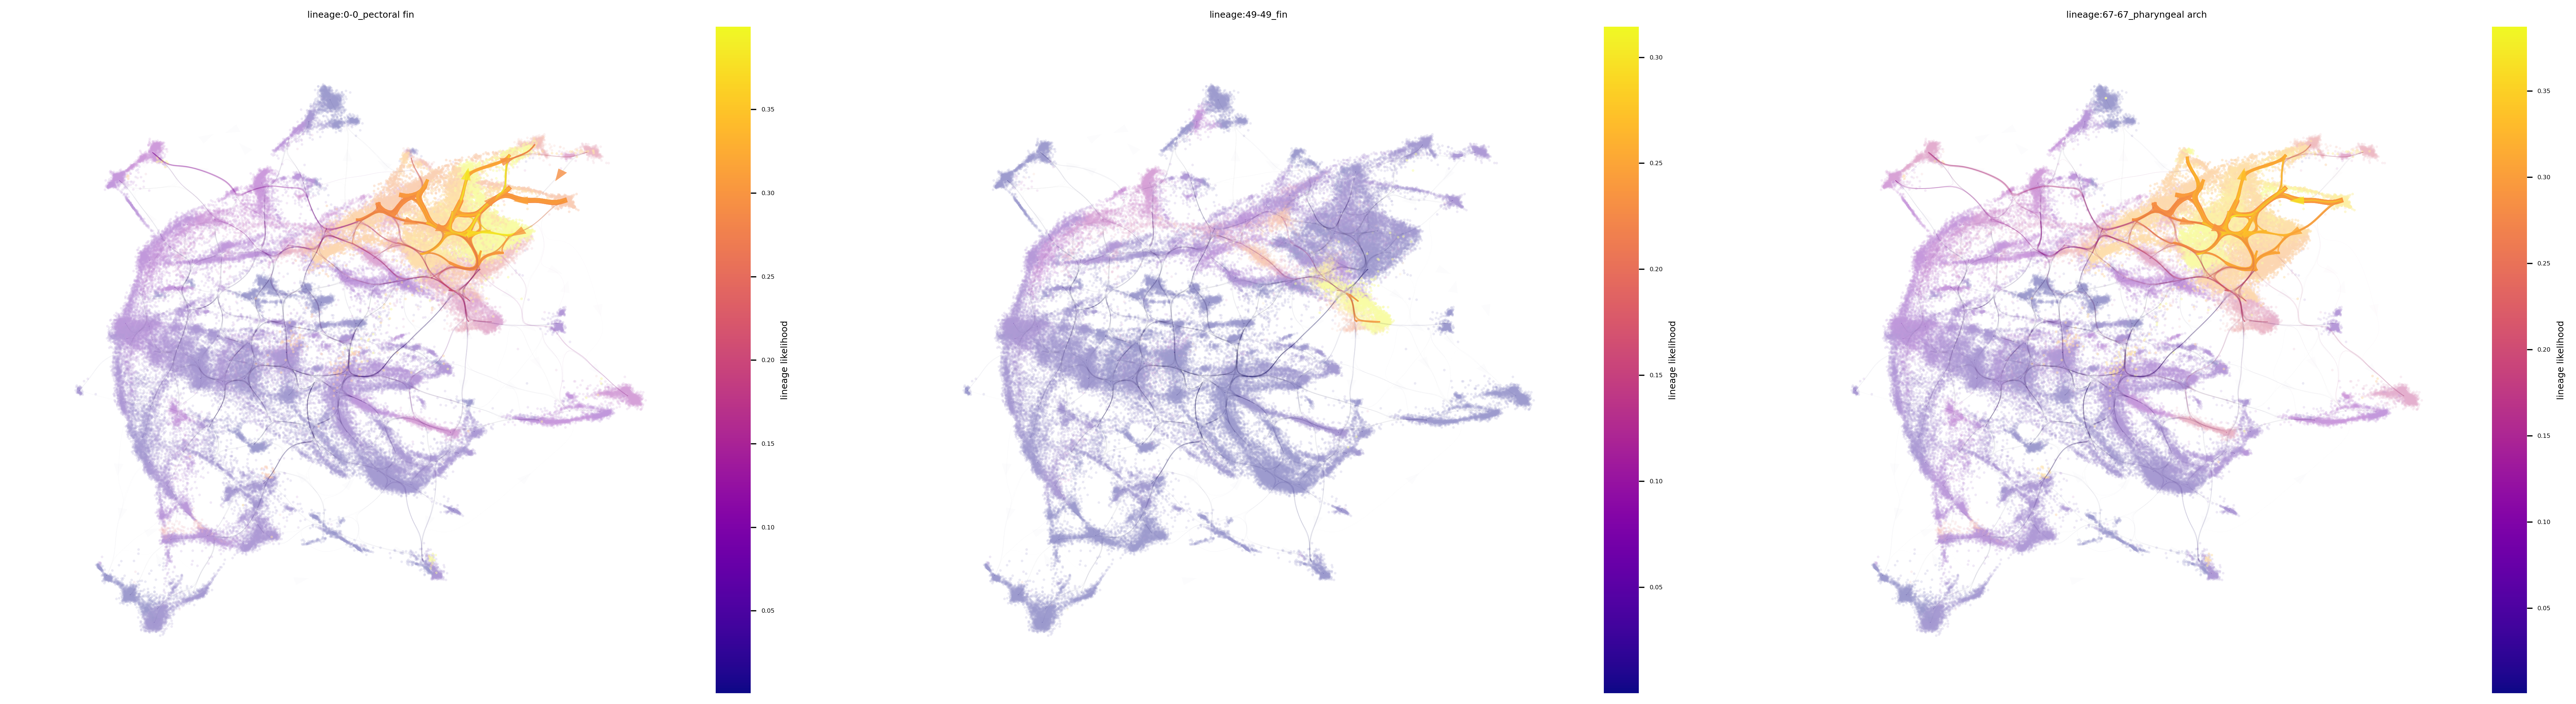
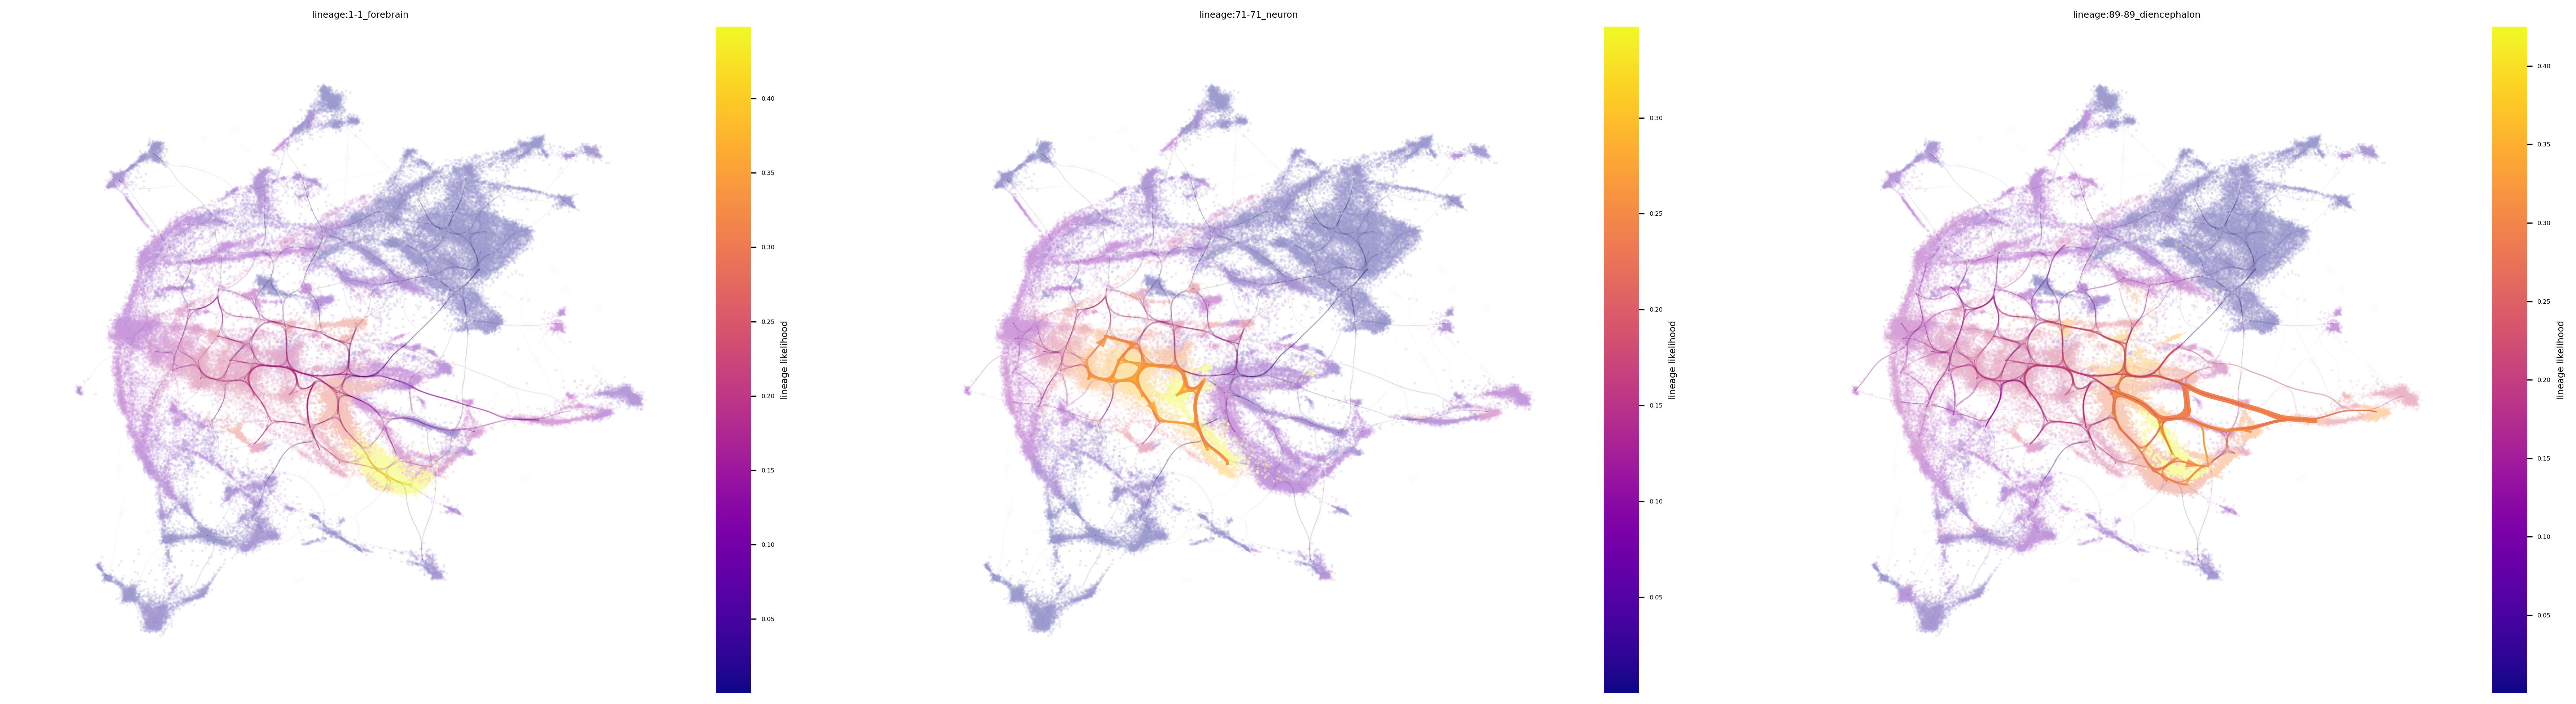
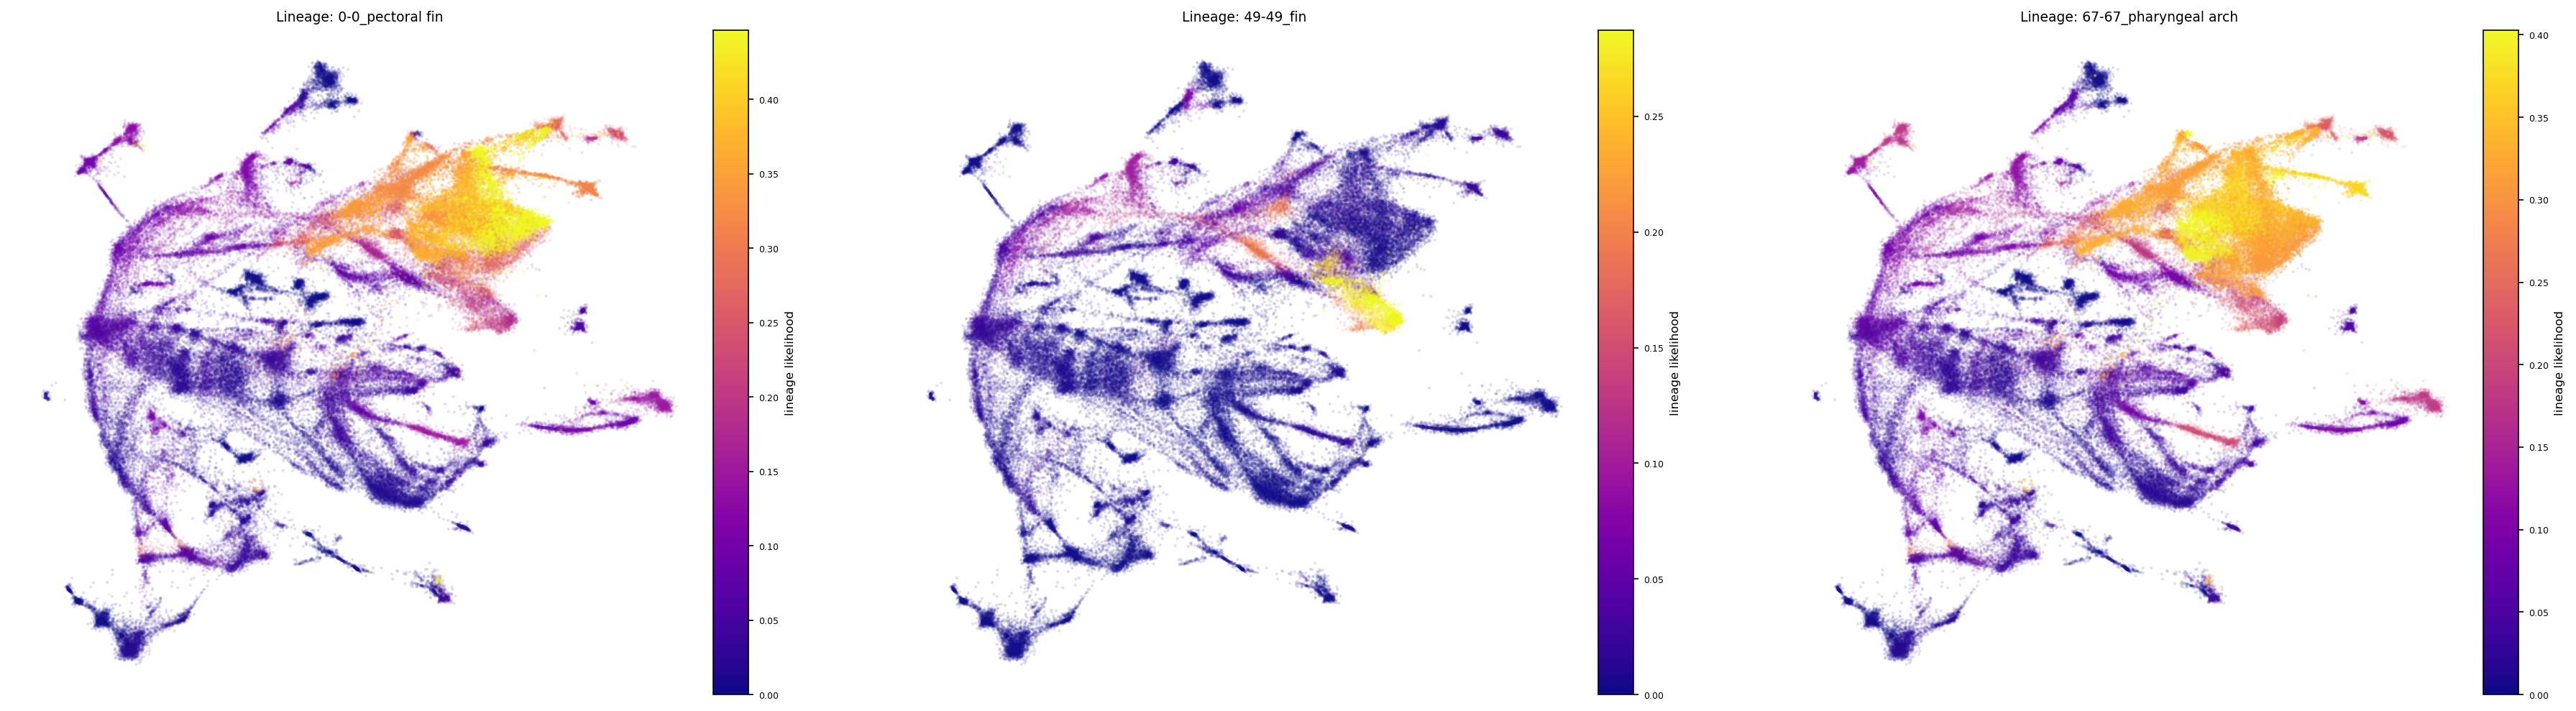
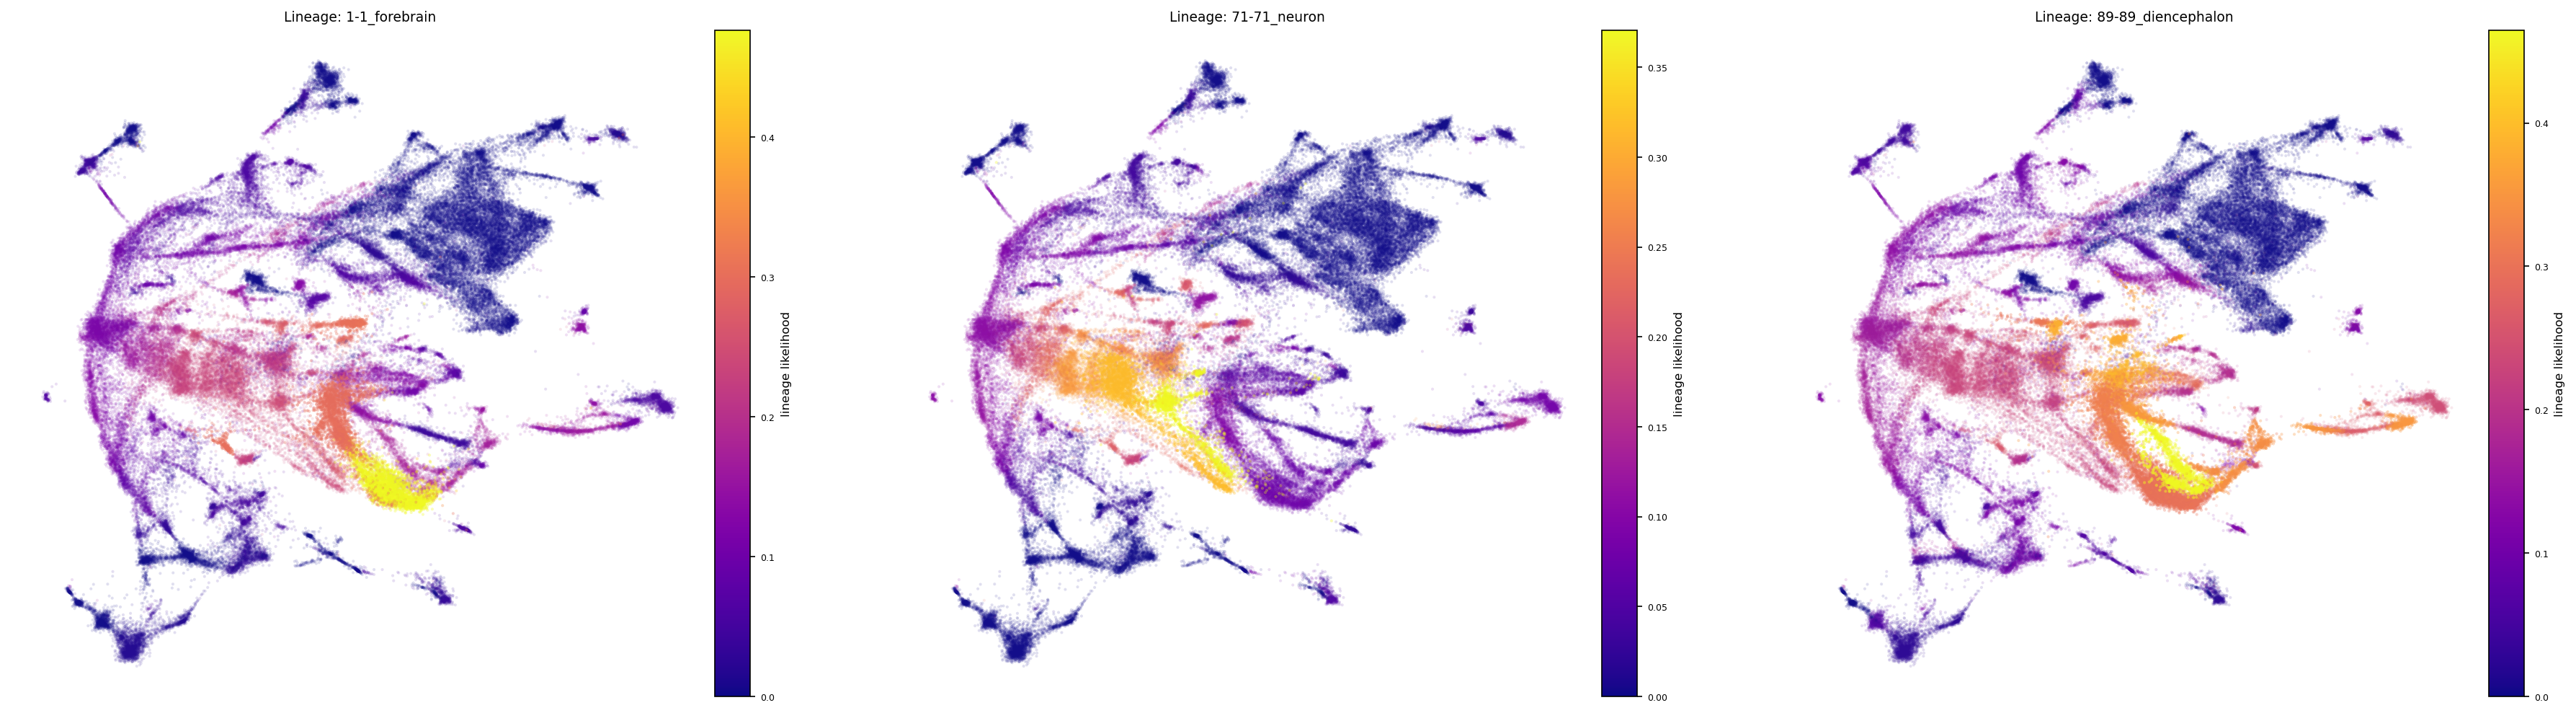
Plot single-cell lineage probabilities
Memory
The lineage probability pathways below are computed based on a memory parameter value of 10 (set when we initialized Via), this is a high degree of memory. The drawback of too high memory can be that some populations are difficult to reach depending on the connectivity of the network. You can always try lowering the value to e.g. 10 or 50.
If you run Via at memory=1 (the no memory case), and then plot the lineage probability pathways and gene trends, you will notice that many of the pathways are diffuse (migrating into unrelated cell populations) and the gene trends can overlap and not be very discriminative.
ecto_lineages=[1,71,89]#,136,10]#,83,115] #CNS
meso_lineages = [0,49,67]#,120,145]#,55,37,46,102]

fig, ax = via.plot_atlas_view(via_object=v0, lineage_pathway=meso_lineages,
                               linewidth_bundle=3, alpha_bundle_factor=2, headwidth_bundle=0.3,
                               size_scatter=0.1, alpha_scatter=0.5, use_sc_labels_sequential_for_direction=True)

fig.set_size_inches(30 , 8)

fig, ax = via.plot_atlas_view(via_object=v0, lineage_pathway=ecto_lineages,
                               linewidth_bundle=3, alpha_bundle_factor=2, headwidth_bundle=0.3,
                               size_scatter=0.1, alpha_scatter=0.5, use_sc_labels_sequential_for_direction=True)
fig.set_size_inches(30 , 8)
fig, ax = via.draw_sc_lineage_probability(via_object=v0, alpha_factor=0.6, scatter_size=4,
                                          marker_lineages=meso_lineages)
fig.set_size_inches(30 , 8)
fig, ax = via.draw_sc_lineage_probability(via_object=v0, alpha_factor=0.6, scatter_size=4,
                                          marker_lineages=ecto_lineages)
fig.set_size_inches(30 , 8)
plt.show()
2023-09-25 09:15:19.086314	Computing Edges
2023-09-25 09:15:19.086621	Start finding milestones
/home/user/anaconda3/envs/Via2Env_py10/lib/python3.10/site-packages/sklearn/cluster/_kmeans.py:870: FutureWarning: The default value of `n_init` will change from 10 to 'auto' in 1.4. Set the value of `n_init` explicitly to suppress the warning
  warnings.warn(
2023-09-25 09:15:49.264351	End milestones with 150
2023-09-25 09:15:50.147607	Recompute weights
2023-09-25 09:15:50.186651	pruning milestone graph based on recomputed weights
2023-09-25 09:15:50.188110	Graph has 1 connected components before pruning
2023-09-25 09:15:50.188877	Graph has 1 connected components after pruning
2023-09-25 09:15:50.189092	Graph has 1 connected components after reconnecting
2023-09-25 09:15:50.191130	regenerate igraph on pruned edges
2023-09-25 09:15:50.266700	Setting numeric label as time_series_labels or other sequential metadata for coloring edges
2023-09-25 09:15:50.554701	Making smooth edges
location of 0 is at [0] and 0
location of 49 is at [2] and 2
location of 67 is at [3] and 3
2023-09-25 09:16:25.367232	Computing Edges
2023-09-25 09:16:25.367304	Start finding milestones
/home/user/anaconda3/envs/Via2Env_py10/lib/python3.10/site-packages/sklearn/cluster/_kmeans.py:870: FutureWarning: The default value of `n_init` will change from 10 to 'auto' in 1.4. Set the value of `n_init` explicitly to suppress the warning
  warnings.warn(
2023-09-25 09:16:53.996278	End milestones with 150
2023-09-25 09:16:54.899173	Recompute weights
2023-09-25 09:16:54.939138	pruning milestone graph based on recomputed weights
2023-09-25 09:16:54.940593	Graph has 1 connected components before pruning
2023-09-25 09:16:54.941371	Graph has 1 connected components after pruning
2023-09-25 09:16:54.941591	Graph has 1 connected components after reconnecting
2023-09-25 09:16:54.943708	regenerate igraph on pruned edges
2023-09-25 09:16:55.014257	Setting numeric label as time_series_labels or other sequential metadata for coloring edges
2023-09-25 09:16:55.267735	Making smooth edges
location of 1 is at [5] and 5
location of 71 is at [6] and 6
location of 89 is at [7] and 7
2023-09-25 09:17:28.852338	Marker_lineages: [0, 49, 67]
2023-09-25 09:17:28.852410	Automatically setting embedding to via_object.embedding
2023-09-25 09:17:28.966372	The number of components in the original full graph is 1
2023-09-25 09:17:28.966428	For downstream visualization purposes we are also constructing a low knn-graph
2023-09-25 09:18:33.313344	Check sc pb 1.0
f getting majority comp
2023-09-25 09:18:39.231618	Cluster path on clustergraph starting from Root Cluster 97 to Terminal Cluster 0: [97, 25, 41, 24, 14, 65, 20, 110, 36, 26, 11, 58, 0]
2023-09-25 09:18:39.231657	Cluster path on clustergraph starting from Root Cluster 97 to Terminal Cluster 2: [97, 25, 41, 24, 14, 65, 20, 110, 36, 26, 43, 79, 15, 34, 2]
2023-09-25 09:18:39.231674	Cluster path on clustergraph starting from Root Cluster 97 to Terminal Cluster 49: [97, 25, 41, 24, 14, 65, 20, 110, 36, 26, 43, 79, 137, 49]
2023-09-25 09:18:39.231688	Cluster path on clustergraph starting from Root Cluster 97 to Terminal Cluster 67: [97, 25, 41, 24, 14, 65, 20, 110, 36, 26, 11, 58, 7, 67]
2023-09-25 09:18:39.231702	Cluster path on clustergraph starting from Root Cluster 97 to Terminal Cluster 120: [97, 25, 41, 24, 14, 65, 20, 110, 36, 26, 11, 58, 0, 120]
2023-09-25 09:18:39.231713	Cluster path on clustergraph starting from Root Cluster 97 to Terminal Cluster 1: [97, 3, 17, 61, 113, 80, 53, 1]
2023-09-25 09:18:39.231724	Cluster path on clustergraph starting from Root Cluster 97 to Terminal Cluster 71: [97, 3, 17, 61, 113, 80, 53, 1, 71]
2023-09-25 09:18:39.231736	Cluster path on clustergraph starting from Root Cluster 97 to Terminal Cluster 89: [97, 3, 17, 9, 92, 50, 8, 23, 32, 89]
2023-09-25 09:18:39.231748	Cluster path on clustergraph starting from Root Cluster 97 to Terminal Cluster 136: [97, 3, 17, 61, 113, 80, 53, 1, 6, 48, 136]
2023-09-25 09:18:39.231761	Cluster path on clustergraph starting from Root Cluster 97 to Terminal Cluster 10: [97, 3, 52, 45, 68, 27, 59, 31, 109, 95, 141, 44, 90, 10]
2023-09-25 09:18:39.231772	Cluster path on clustergraph starting from Root Cluster 97 to Terminal Cluster 83: [97, 3, 52, 45, 68, 27, 59, 31, 83]
2023-09-25 09:18:39.231785	Cluster path on clustergraph starting from Root Cluster 97 to Terminal Cluster 145: [97, 25, 41, 24, 14, 65, 20, 110, 36, 26, 43, 79, 15, 145]
2023-09-25 09:18:39.231796	Cluster path on clustergraph starting from Root Cluster 97 to Terminal Cluster 55: [97, 25, 41, 24, 14, 65, 20, 55]
2023-09-25 09:18:39.231806	Cluster path on clustergraph starting from Root Cluster 97 to Terminal Cluster 46: [97, 54, 70, 117, 86, 46]
2023-09-25 09:18:39.231815	Cluster path on clustergraph starting from Root Cluster 97 to Terminal Cluster 102: [97, 54, 70, 96, 76, 102]
2023-09-25 09:18:39.231826	Cluster path on clustergraph starting from Root Cluster 97 to Terminal Cluster 127: [97, 3, 17, 9, 92, 50, 8, 23, 32, 22, 127]
2023-09-25 09:18:39.231839	Cluster path on clustergraph starting from Root Cluster 97 to Terminal Cluster 105: [97, 3, 17, 9, 92, 50, 8, 23, 32, 22, 128, 107, 105]
2023-09-25 09:18:39.231851	Cluster path on clustergraph starting from Root Cluster 97 to Terminal Cluster 69: [97, 3, 52, 45, 68, 27, 59, 31, 109, 130, 69]
2023-09-25 09:18:39.231864	Cluster path on clustergraph starting from Root Cluster 97 to Terminal Cluster 90: [97, 3, 52, 45, 68, 27, 59, 31, 109, 95, 141, 44, 90]
2023-09-25 09:18:39.231875	Cluster path on clustergraph starting from Root Cluster 97 to Terminal Cluster 95: [97, 3, 52, 45, 68, 27, 59, 31, 109, 95]
2023-09-25 09:18:39.357220	Revised Cluster level path on sc-knnGraph from Root Cluster 97 to Terminal Cluster 0 along path: [54, 3, 53, 0, 0, 0, 0, 0, 0]
2023-09-25 09:18:39.440505	Revised Cluster level path on sc-knnGraph from Root Cluster 97 to Terminal Cluster 49 along path: [54, 54, 54, 75, 120, 49, 49, 49, 49]
2023-09-25 09:18:39.536499	Revised Cluster level path on sc-knnGraph from Root Cluster 97 to Terminal Cluster 67 along path: [54, 54, 54, 54, 54, 28, 7, 7, 7, 7]
2023-09-25 09:18:39.552106	Marker_lineages: [1, 71, 89]
2023-09-25 09:18:39.552142	Automatically setting embedding to via_object.embedding
2023-09-25 09:18:39.666859	The number of components in the original full graph is 1
2023-09-25 09:18:39.666929	For downstream visualization purposes we are also constructing a low knn-graph
2023-09-25 09:19:43.632672	Check sc pb 1.0
f getting majority comp
2023-09-25 09:19:49.565437	Cluster path on clustergraph starting from Root Cluster 97 to Terminal Cluster 0: [97, 25, 41, 24, 14, 65, 20, 110, 36, 26, 11, 58, 0]
2023-09-25 09:19:49.565473	Cluster path on clustergraph starting from Root Cluster 97 to Terminal Cluster 2: [97, 25, 41, 24, 14, 65, 20, 110, 36, 26, 43, 79, 15, 34, 2]
2023-09-25 09:19:49.565489	Cluster path on clustergraph starting from Root Cluster 97 to Terminal Cluster 49: [97, 25, 41, 24, 14, 65, 20, 110, 36, 26, 43, 79, 137, 49]
2023-09-25 09:19:49.565504	Cluster path on clustergraph starting from Root Cluster 97 to Terminal Cluster 67: [97, 25, 41, 24, 14, 65, 20, 110, 36, 26, 11, 58, 7, 67]
2023-09-25 09:19:49.565518	Cluster path on clustergraph starting from Root Cluster 97 to Terminal Cluster 120: [97, 25, 41, 24, 14, 65, 20, 110, 36, 26, 11, 58, 0, 120]
2023-09-25 09:19:49.565529	Cluster path on clustergraph starting from Root Cluster 97 to Terminal Cluster 1: [97, 3, 17, 61, 113, 80, 53, 1]
2023-09-25 09:19:49.565540	Cluster path on clustergraph starting from Root Cluster 97 to Terminal Cluster 71: [97, 3, 17, 61, 113, 80, 53, 1, 71]
2023-09-25 09:19:49.565553	Cluster path on clustergraph starting from Root Cluster 97 to Terminal Cluster 89: [97, 3, 17, 9, 92, 50, 8, 23, 32, 89]
2023-09-25 09:19:49.565569	Cluster path on clustergraph starting from Root Cluster 97 to Terminal Cluster 136: [97, 3, 17, 61, 113, 80, 53, 1, 6, 48, 136]
2023-09-25 09:19:49.565583	Cluster path on clustergraph starting from Root Cluster 97 to Terminal Cluster 10: [97, 3, 52, 45, 68, 27, 59, 31, 109, 95, 141, 44, 90, 10]
2023-09-25 09:19:49.565594	Cluster path on clustergraph starting from Root Cluster 97 to Terminal Cluster 83: [97, 3, 52, 45, 68, 27, 59, 31, 83]
2023-09-25 09:19:49.565606	Cluster path on clustergraph starting from Root Cluster 97 to Terminal Cluster 145: [97, 25, 41, 24, 14, 65, 20, 110, 36, 26, 43, 79, 15, 145]
2023-09-25 09:19:49.565617	Cluster path on clustergraph starting from Root Cluster 97 to Terminal Cluster 55: [97, 25, 41, 24, 14, 65, 20, 55]
2023-09-25 09:19:49.565627	Cluster path on clustergraph starting from Root Cluster 97 to Terminal Cluster 46: [97, 54, 70, 117, 86, 46]
2023-09-25 09:19:49.565637	Cluster path on clustergraph starting from Root Cluster 97 to Terminal Cluster 102: [97, 54, 70, 96, 76, 102]
2023-09-25 09:19:49.565648	Cluster path on clustergraph starting from Root Cluster 97 to Terminal Cluster 127: [97, 3, 17, 9, 92, 50, 8, 23, 32, 22, 127]
2023-09-25 09:19:49.565661	Cluster path on clustergraph starting from Root Cluster 97 to Terminal Cluster 105: [97, 3, 17, 9, 92, 50, 8, 23, 32, 22, 128, 107, 105]
2023-09-25 09:19:49.565673	Cluster path on clustergraph starting from Root Cluster 97 to Terminal Cluster 69: [97, 3, 52, 45, 68, 27, 59, 31, 109, 130, 69]
2023-09-25 09:19:49.565685	Cluster path on clustergraph starting from Root Cluster 97 to Terminal Cluster 90: [97, 3, 52, 45, 68, 27, 59, 31, 109, 95, 141, 44, 90]
2023-09-25 09:19:49.565696	Cluster path on clustergraph starting from Root Cluster 97 to Terminal Cluster 95: [97, 3, 52, 45, 68, 27, 59, 31, 109, 95]
2023-09-25 09:19:49.689435	Revised Cluster level path on sc-knnGraph from Root Cluster 97 to Terminal Cluster 1 along path: [54, 3, 1, 1, 1, 1]
2023-09-25 09:19:49.777811	Revised Cluster level path on sc-knnGraph from Root Cluster 97 to Terminal Cluster 71 along path: [54, 3, 80, 71, 71]
2023-09-25 09:19:49.872623	Revised Cluster level path on sc-knnGraph from Root Cluster 97 to Terminal Cluster 89 along path: [54, 3, 1, 89]
Differentiation Flow
Generates a differentiation flow diagram based on the Via2.0 clustergraph. The second plot in each function call has the details by parc cluster and major cell population. In this case, we assign a different root node for each set of lineages.
ecto_lineages=[1,22,71,89,136,10,83,115] #CNS
meso_lineages = [0,49,67,120,145,55,37,46,102]
via.draw_differentiation_flow(via_object=v0, marker_lineages=meso_lineages, label_node=coarse_fine_cell_type,
                              do_log_flow=True, root_cluster_list=[97])  # cluster corresponding to root

via.draw_differentiation_flow(via_object=v0, marker_lineages=ecto_lineages, label_node=coarse_fine_cell_type,
                              do_log_flow=True, root_cluster_list=[52])  # cluster corresponding to a suitable CNS root
plt.show()
2023-09-25 08:49:15.613940	Marker_lineages: [0, 49, 67, 120, 145, 55, 37, 46, 102]
automatically setting embedding to via_object.embedding
2023-09-25 08:49:15.614169	Start dictionary modes
2023-09-25 08:49:15.852553	End dictionary modes
2023-09-25 08:49:18.016249	Check sc pb 1.0
2023-09-25 08:49:25.668206	Cluster path on clustergraph starting from Root Cluster 97 to Terminal Cluster 0: [97, 25, 41, 24, 14, 65, 20, 110, 36, 26, 11, 58, 0]


2023-09-25 08:49:25.741354	Holoviews for TC 0
dest 0, is at loc 0 on the bp_array
2023-09-25 08:49:25.741804	Cluster path on clustergraph starting from Root Cluster 97 to Terminal Cluster 49: [97, 25, 41, 24, 14, 65, 20, 110, 36, 26, 43, 79, 137, 49]
2023-09-25 08:49:25.806408	Holoviews for TC 49
dest 49, is at loc 2 on the bp_array
2023-09-25 08:49:25.807038	Cluster path on clustergraph starting from Root Cluster 97 to Terminal Cluster 67: [97, 25, 41, 24, 14, 65, 20, 110, 36, 26, 11, 58, 7, 67]
2023-09-25 08:49:25.840009	Holoviews for TC 67
dest 67, is at loc 3 on the bp_array
2023-09-25 08:49:25.840436	Cluster path on clustergraph starting from Root Cluster 97 to Terminal Cluster 120: [97, 25, 41, 24, 14, 65, 20, 110, 36, 26, 11, 58, 0, 120]
2023-09-25 08:49:25.889504	Holoviews for TC 120
dest 120, is at loc 4 on the bp_array
2023-09-25 08:49:25.889883	Cluster path on clustergraph starting from Root Cluster 97 to Terminal Cluster 145: [97, 25, 41, 24, 14, 65, 20, 110, 36, 26, 43, 79, 15, 145]
2023-09-25 08:49:25.941053	Holoviews for TC 145
dest 145, is at loc 11 on the bp_array
2023-09-25 08:49:25.941432	Cluster path on clustergraph starting from Root Cluster 97 to Terminal Cluster 55: [97, 25, 41, 24, 14, 65, 20, 55]
2023-09-25 08:49:26.001078	Holoviews for TC 55
dest 55, is at loc 12 on the bp_array
2023-09-25 08:49:26.001825	Cluster path on clustergraph starting from Root Cluster 97 to Terminal Cluster 37: [97, 54, 70, 57, 125, 37]
2023-09-25 08:49:26.052467	Holoviews for TC 37
2023-09-25 08:49:26.052785	Cluster path on clustergraph starting from Root Cluster 97 to Terminal Cluster 46: [97, 54, 70, 117, 86, 46]
2023-09-25 08:49:26.113529	Holoviews for TC 46
dest 46, is at loc 13 on the bp_array
2023-09-25 08:49:26.114352	Cluster path on clustergraph starting from Root Cluster 97 to Terminal Cluster 102: [97, 54, 70, 96, 76, 102]
2023-09-25 08:49:26.179086	Holoviews for TC 102
dest 102, is at loc 14 on the bp_array
2023-09-25 08:49:26.182116	Start sankey
2023-09-25 08:49:26.272915	make sankey color dict
2023-09-25 08:49:26.274535	set options and render
2023-09-25 08:49:27.354921	Marker_lineages: [1, 22, 71, 89, 136, 10, 83, 115]
automatically setting embedding to via_object.embedding
2023-09-25 08:49:27.355000	Start dictionary modes
2023-09-25 08:49:27.545101	End dictionary modes
2023-09-25 08:49:29.465100	Check sc pb 1.0
2023-09-25 08:49:35.972127	Cluster path on clustergraph starting from Root Cluster 52 to Terminal Cluster 1: [52, 3, 17, 61, 113, 80, 53, 1]
2023-09-25 08:49:36.004311	Holoviews for TC 1
dest 1, is at loc 5 on the bp_array
2023-09-25 08:49:36.004850	Cluster path on clustergraph starting from Root Cluster 52 to Terminal Cluster 22: [52, 3, 17, 9, 92, 50, 8, 23, 32, 22]
2023-09-25 08:49:36.043009	Holoviews for TC 22
2023-09-25 08:49:36.043484	Cluster path on clustergraph starting from Root Cluster 52 to Terminal Cluster 71: [52, 3, 17, 61, 113, 80, 53, 1, 71]
2023-09-25 08:49:36.088468	Holoviews for TC 71
dest 71, is at loc 6 on the bp_array
2023-09-25 08:49:36.089030	Cluster path on clustergraph starting from Root Cluster 52 to Terminal Cluster 89: [52, 3, 17, 9, 92, 50, 8, 23, 32, 89]
2023-09-25 08:49:36.139421	Holoviews for TC 89
dest 89, is at loc 7 on the bp_array
2023-09-25 08:49:36.139808	Cluster path on clustergraph starting from Root Cluster 52 to Terminal Cluster 136: [52, 3, 17, 61, 113, 80, 53, 1, 6, 48, 136]
2023-09-25 08:49:36.198432	Holoviews for TC 136
dest 136, is at loc 8 on the bp_array
2023-09-25 08:49:36.198699	Cluster path on clustergraph starting from Root Cluster 52 to Terminal Cluster 10: [52, 45, 68, 27, 59, 31, 109, 95, 141, 44, 90, 10]
2023-09-25 08:49:36.264525	Holoviews for TC 10
dest 10, is at loc 9 on the bp_array
2023-09-25 08:49:36.264947	Cluster path on clustergraph starting from Root Cluster 52 to Terminal Cluster 83: [52, 45, 68, 27, 59, 31, 83]
2023-09-25 08:49:36.322102	Holoviews for TC 83
dest 83, is at loc 10 on the bp_array
2023-09-25 08:49:36.322475	Cluster path on clustergraph starting from Root Cluster 52 to Terminal Cluster 115: [52, 45, 68, 27, 98, 138, 142, 66, 78, 115]
2023-09-25 08:49:36.379335	Holoviews for TC 115
2023-09-25 08:49:36.381979	Start sankey
2023-09-25 08:49:36.459963	make sankey color dict
2023-09-25 08:49:36.462874	set options and render